
Case study · Product strategy and go-to-market

From a research question to a product in market.

Breeders were choosing crosses from popularity lists. I developed a predictive method from nearly 200,000 records, led the product design and AI-assisted engineering, and took it to market with its own brand, website and marketplace.

Role
Product lead, UX and UI
Scope
Research to launch
Data
~200,000 records
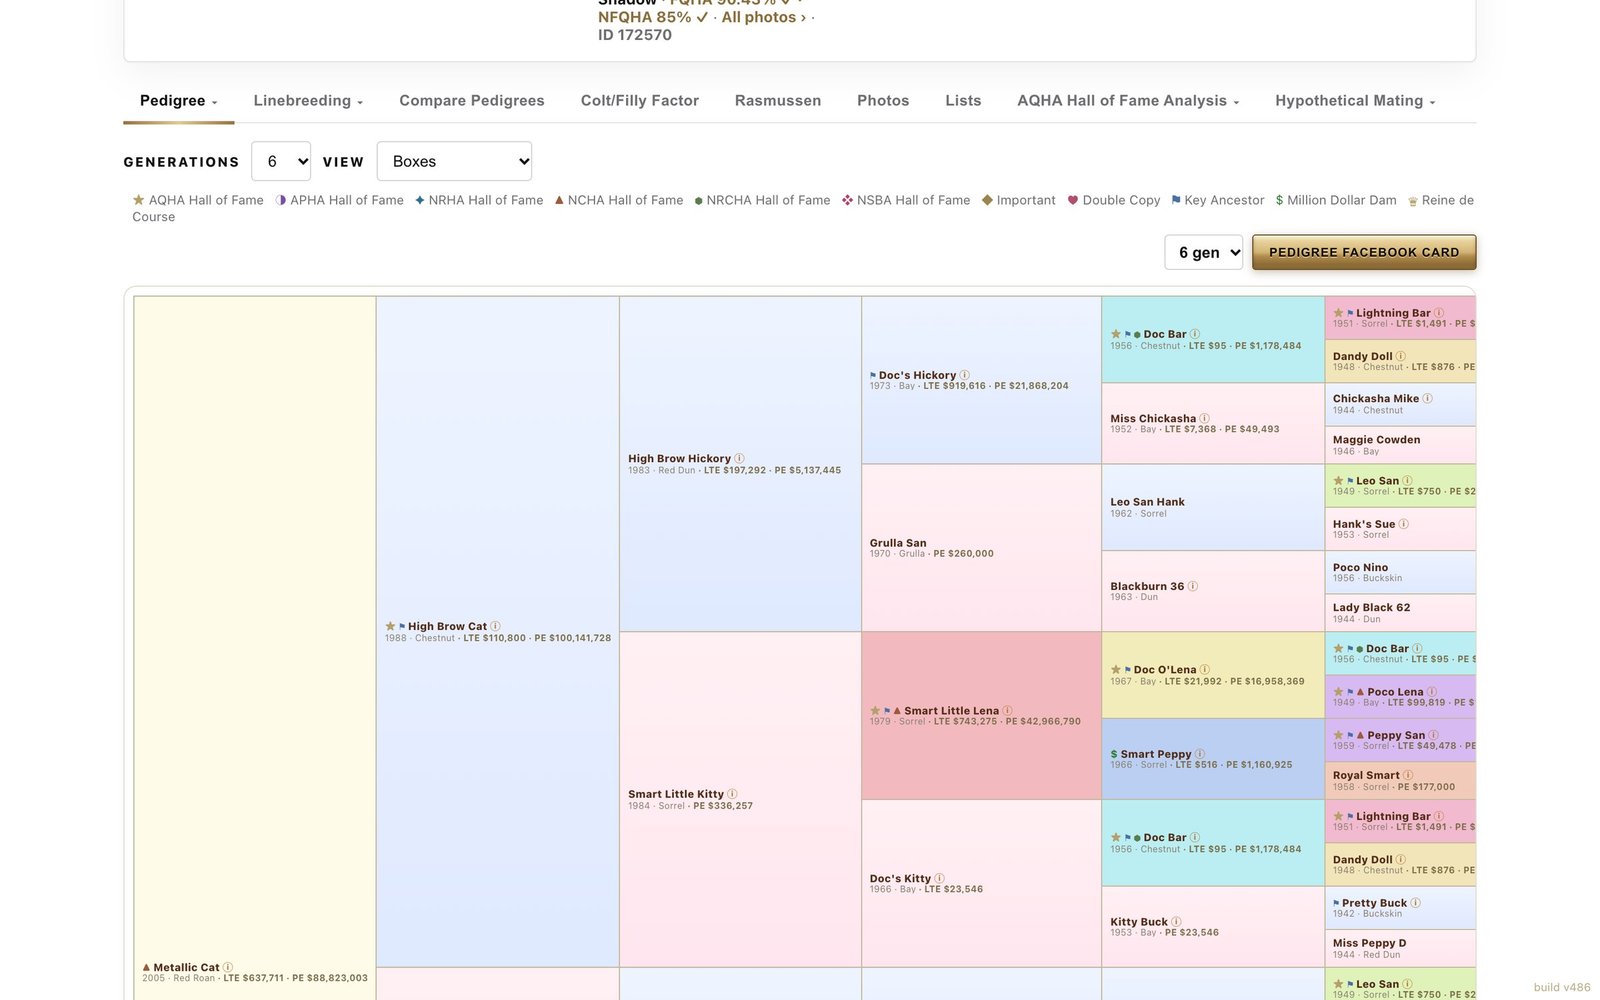
Quarternicks screen: Twenty generations, not three

Read the horse

Twenty generations, not three

Every horse opens to its pedigree with Hall of Fame, Key Ancestor and Million Dollar Dam markers. Where most breeders stop at three generations, Quarternicks reads influence across twenty.

Tap the screen, the gold point, or swipe

The brief

The problem, and the solution.

The problem

Industry breeding reports ranked crosses by past earnings. That favored the most popular stallions and could not predict whether a cross fit one specific mare, so breeders were committing a mare, a season and a stud fee to a popularity list.

The solution

A predictive model built from nearly 200,000 pedigrees and the 800 all-time top earners across 16 AQHA disciplines. It scores genetics and conformation against each discipline’s elite profile, gives past earnings only 5% of the weight, and ranks stallions for an individual mare.

How I approached it

From the problem to the product.

  1. 01

    Found the gap

    Every nicking report in the industry tallied past earnings. None could predict a specific cross.

  2. 02

    Ran the research

    Measured nearly 200,000 pedigrees and analyzed the 800 all-time top earners across 16 disciplines.

  3. 03

    Defined the model

    Weighted what predicts a foal: conformation 40%, pedigree architecture 35%, nicking 20%, earnings 5%.

  4. 04

    Designed the product

    Designed every screen of the UX and UI, from the pedigree view to the mating comparisons.

  5. 05

    Engineered with AI

    Delivered through AI-assisted engineering and validated against real pedigrees.

  6. 06

    Took it to market

    Positioning, messaging, brand, website, report products and a marketplace the software feeds.

Inside the model

What Quarternicks actually measures.

Real data from the software. Flip the scoring model, then pick a discipline and watch its signature change.

What decides the score

Quarternicks weights what predicts a foal. Past earnings get 5%.

40%Conformation
35%Pedigree architecture
20%Nicking
5%Earnings
Past earnings

Every discipline has a signature

The top horses in each event share an inherited trait profile. Pick a discipline to see its shape.

565 earning horses
  1. Stop/Turn 22.4%
  2. Explosive 17.6%
  3. Cow 15.7%

Share of the inherited trait profile, %. Data from the Quarternicks database.

195,954
pedigrees in the database, and growing
800 all-time top earners analyzed across 16 AQHA disciplines
18,716
crosses on file from traditional breeding reports

My role

I identified the gap, created the methodology and its trademarked Hall of Fame and Trait Analysis™, led the research and defined the scoring model. I led product design across every screen of the UX and UI and delivered the software through AI-assisted engineering. I then owned the go-to-market: positioning, messaging, brand, website, report products and an online marketplace the software feeds directly.

Skills demonstrated

  • Product strategy
  • Market research
  • Data analysis
  • UX and UI design
  • AI-assisted engineering
  • Positioning and messaging
  • Go-to-market