
Case study · Operations and people analytics

Supervisor reviews, turned into a system.

A manufacturing plant’s production leadership rates every supervisor each quarter against a 90-behavior rubric. I led the design and AI-assisted engineering of a desktop scorecard that scores each review live and surfaces the whole team’s strengths, gaps and progress. It is now in use for quarterly reviews.

Role
Product lead, UX and UI
Rubric
90 behaviors, 5 categories
Platform
Mac and Windows
Status
In use
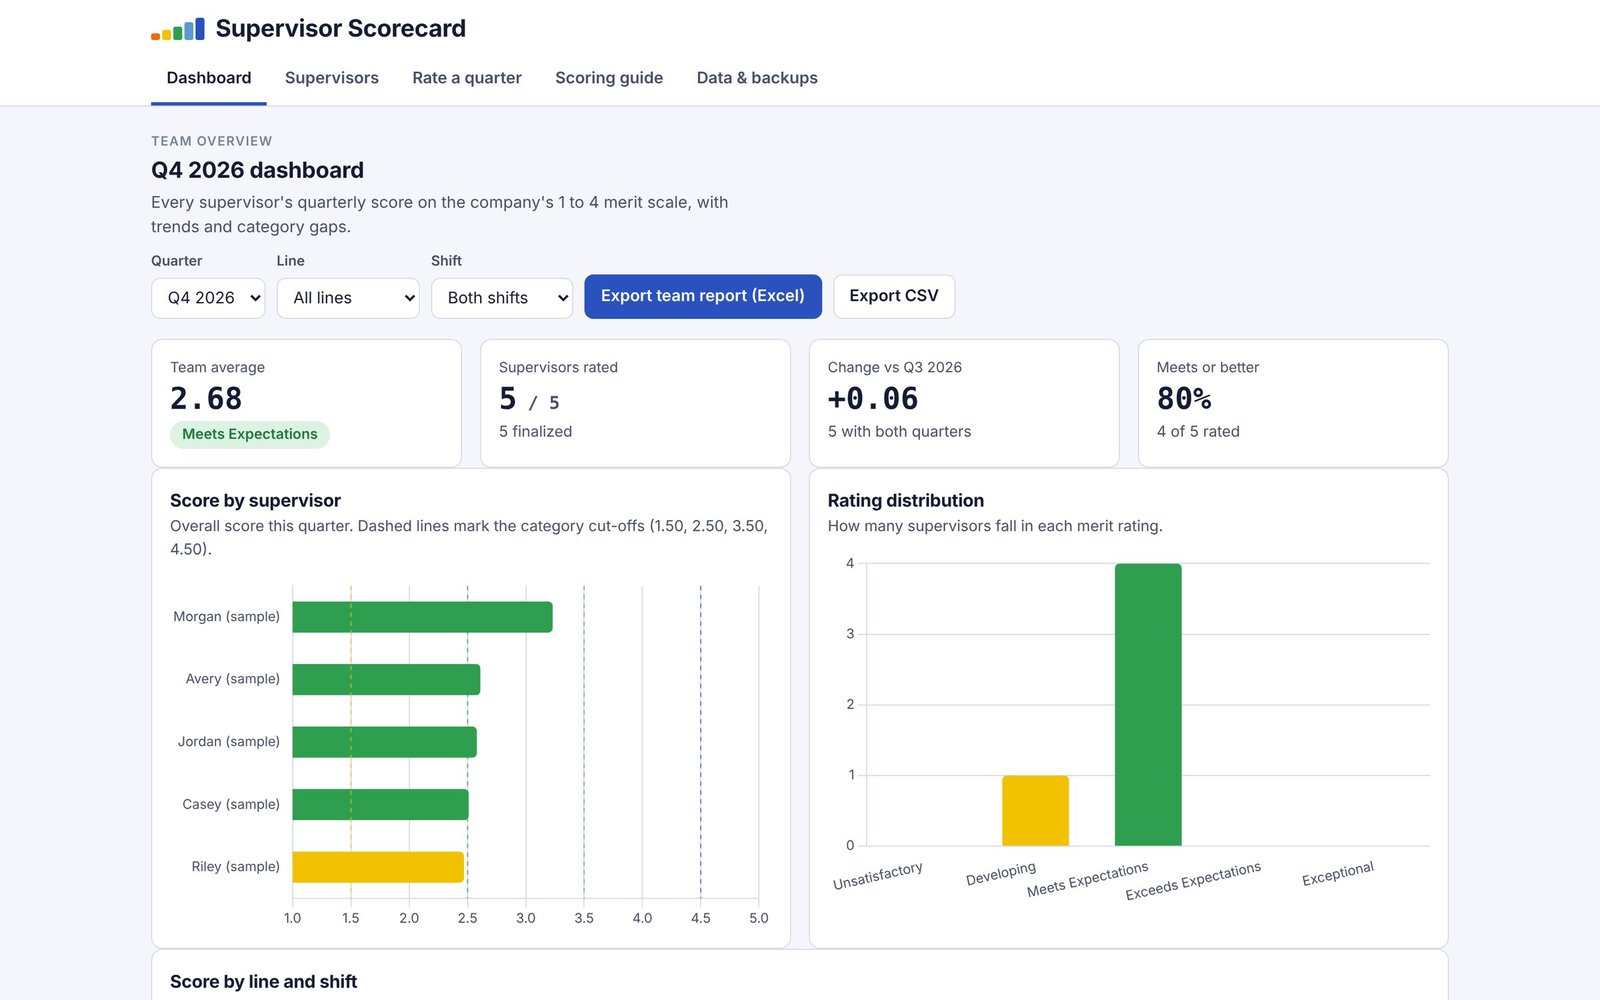
Supervisor Scorecard screen: The whole team on one screen

The whole team on one screen

Team average, supervisors rated, quarter-over-quarter change and the share meeting expectations, filtered by quarter, line and shift.

Tap the screen, the gold point, or swipe

The brief

The problem, and the solution.

The problem

Production leadership at a manufacturing plant reviews every supervisor each quarter against a 90-behavior, five-category weighted rubric. Scoring it consistently across raters, and seeing strengths, gaps and trends across lines, shifts and quarters, is slow and hard to do by hand.

The solution

A Mac and Windows desktop app that turns the rubric into a guided quarterly review. Each behavior is rated Lacks, Has, Teaches Team or Teaches Peers, and the weighted score and merit rating calculate live. A team dashboard shows scores by line and shift, progress over time, score versus momentum and a category heat map. Records stay in a local SQL database with daily auto-backups and Excel and CSV reports.

How I approached it

From the problem to the product.

  1. 01

    Defined the problem

    Worked with plant leadership on what a fair, consistent quarterly review needs to capture.

  2. 02

    Built the scoring model

    Turned the company rubric into 90 rated behaviors across five weighted categories and a five-band merit scale.

  3. 03

    Designed the review flow

    Rate on evidence, leave unseen behaviors blank, and require supporting facts for the highest and lowest ratings.

  4. 04

    Designed the analytics

    Team, line, shift and quarter views, score versus momentum and a category heat map.

  5. 05

    Designed the UX and UI

    A clear, fast workspace for leaders who review on the floor, not at a desk.

  6. 06

    Engineered with AI

    Delivered through AI-assisted engineering: a local SQL database, daily auto-backups, and Excel and CSV reporting on Mac and Windows.

Signature feature

Rate a quarter. Watch the score.

Each category is weighted. Choose the level you observed and the merit rating recalculates, exactly as it does in the app.

Coaching and Team Building28% of overall
Personal Leadership and Professionalism23% of overall
Communication22% of overall
Bias for Action16% of overall
Technical Skill11% of overall

Overall score

0.00

Lacks 1 · Has 3 · Teaches Team 4 · Teaches Peers 5. Illustrative: in the app each category is scored from its own behaviors.

My role

I partnered with plant leadership to define the problem, translated the company’s review rubric into a weighted scoring model, and designed the review workflow, the analytics and every screen of the UX and UI. I delivered the system through AI-assisted engineering. It is in use for quarterly supervisor reviews.

Skills demonstrated

  • Operations analytics
  • People analytics
  • Scoring model design
  • Data visualization
  • UX and UI design
  • AI-assisted engineering